
Water quality monitors and data can confirm if chlorine, or other water quality parameters, are generally at levels required by the water company and regulators of the water industry.
At present this does not replace regulated laboratory sampling for more complex aspects of water quality. Modern and reliable equipment for spot sampling and permanent sampling, through a range of sensors*, at sites is essential for reservoir health checks. You can have confidence very quickly that the data being reviewed is accurate and reliable. This will provide that indicative health check of the reservoirs condition. Also, reservoir operation can be determined from data nuances.
The data set below is a case in point of how chlorine data, reservoir level data and a little bit of local knowledge completely overturned previous understanding of the reservoir operation and highlighted the risks at this site.
The data confirms chlorine arriving at a reservoir is sufficiently high that it should provide a suitably disinfected outlet residual of the reservoir.
What do nuances of this data tell us before we look at the outlet?
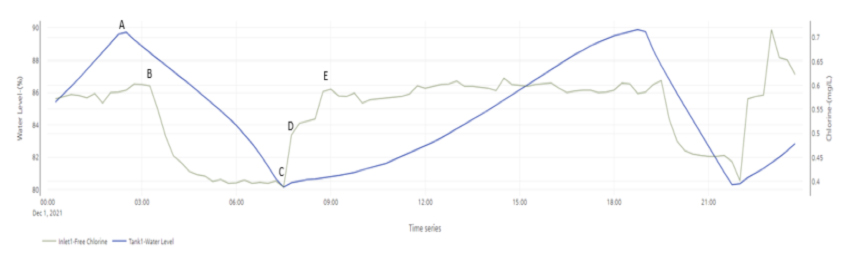
For information the reservoir level indicates an inflow filling by rising blue line slope and not filling on down slope (confirmed by meter flow at pumping site supplying this reservoir). Out flow can occur at all times. The inlet main remains pressurised at all times either by inflow or outflow via cross connections at the reservoir site causing a reverse flow toward the supplying pump site. Chlorine dosing occurs at the pump site supplying the reservoir.
At point A the reservoir stops filling and outflow only is shown by downward slope of reservoir level.
Up to and past point A chlorine residual being monitored is stable. Sometime later at point B the residual level starts to drop dramatically. The residual then levels out up to point C.
This indicates that the main and the supply to the analyser for the inlet monitor holds some of the chlorinated water at the level being supplied for a short time. As the pipe feeds in reverse the chlorine starts to dissipate and the analysers starts to record reservoir content water, supplied from the outlet mains cross connected to the inlet main.
At point C the reservoir starts to fill again and a sharp increase in residual is seen. This indicates a retention of chlorinated water in the inlet main and shows there is a flow but not significant in the reverse direction. The forward inlet flow causes the residual to rises quickly. Further evidence for this is due to the second step in residual level at point D as water that chlorine has not dissipated as much, starts to arrive at the reservoir and later the dosing at the pump site takes effect. At point E the dosing effect levels off, showing the residual now being a constant in the supply water. This pattern is repeated on the regular fill and empty cycle of the reservoir.
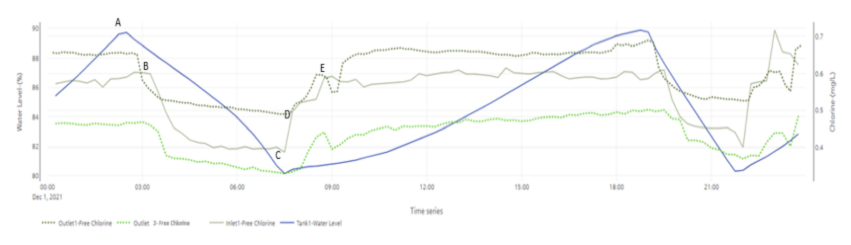
Adding outlet data to the above brings further understanding of the water quality in this reservoir and the way the site operates due to its mains connectivity.
The two additional lines are both outlet chlorine residuals. The data is from monitors on separate outlets of the reservoir. Prior to point A both outlet residuals are at a steady level. This is at the time when the reservoir is filling. Around point B both outlet monitors show the residual levels start to fall as the reservoir stops filling. Between points B and C, the outlet residuals slowly fall as the reservoir empties until the reservoir starts to fill again at point C. This profile is seen too in the inlet residual trace. Why is this happening? And how does the data help us understand what is occurring?
The flow to the cell is now from water in the main with only background residual and that chlorine content is slowly degrading. Issues are similar to the previous bullet point and again of little concern unless there are low level alarms that will shut the system down. If there is concern around having low alarms too low, then software and controls at the site will need refining.
Although the data is from a post dose monitor a similar thing can happen on a Pre-Dose analyser, if fitted. In most cases it is of little consequence and understanding why it is happening may be all that is required if no control or warnings are related to a pre-dose analyser. The exception to this would be with a feed forward dosing system. The following conclusions can be reached without any knowledge of the inlet and outlet mains configuration. Confirmation of the mains connectivity and valve positions was later provided when the anomalies here were discussed and were presented to the water company.
Prior to points A and B all the three monitors were recording reasonably high inlet chlorine levels in the supply to the reservoir. This is due to the connectivity at site of the inlet mains and outlet mains. In effect the inlet supply water is by passing the reservoir at filling times.
An unknown percentage of the water being suppled to site is going straight into supply from the inlet to the outlet mains and the rest is filling the reservoir. It is possible to calculate the percentages, but to date this has not been done. Bypassing is confirmed by what happens after point C when the reservoir starts to fill.
All three monitors show an increase in chlorine residual and after point E start to level off as a steady residual from the dosed supply water is seen at the reservoir site. If the inlet and outlet mains were not open to each other this could not happen and the mirroring of the profiles confirms too the by passing of the reservoir as inlet water and outlet water residual follow the same profiles. Though the residuals are different levels this is due to the sensors possibly requiring calibrations and or the travel time of the water to the sensors. This does not mean there is a flaw in the conclusions as the profiles are the key to these deductions.
Of interest to is the lower chlorine levels between B and C when they appear to slowly taper off. While the reservoir is emptying the residual eventually seem to follow a slow decline in residual levels to point C when the fill starts again. This slow decline and no apparent even or level profile would indicate that the true residual in the reservoir is not seen as the downhill gradient does not bottom out. Though the residual seen between B and C are the closest indicative levels of chlorine in the reservoir. In this data set the true reservoir residual is not visible due to the fill starting and thus re elevating the chlorine levels to the inlet residual after point C, through D and to and beyond E.
Conclusions
- The reservoir turnover or change of water internally to the reservoir is poor and a potential quality risk.
- The regulatory samples are not guaranteed to be a true representative of water quality at this reservoir.
- Customers will see varying chlorine residual levels and not an even steady level.
- Local company knowledge of this site was worryingly flawed.
- Lack of knowledge around this site’s operation would hinder evaluation for any customer impacts should an event occur.
- There is significant risk of “dead” quality areas in the reservoir and slow or static water in pipes at this location containing poor quality water.
- An event could pull potentially poor-quality water into supply to customers.
Featured Article
Chlorine spikes and what they can tell us
Chlorine residuals change during dosing and when the dosing equipment is paused, this is taken as normal operation…
ReadRelated content

Badger Meter Enhances Smart Water Capabilities With Acquisit…
Badger Meter continues to invest in its industry-leading smart water offerings. and is pleased to announce the acquisition of Syrinix, Ltd, a privately held provider of intelligent water monitoring solutions.
Read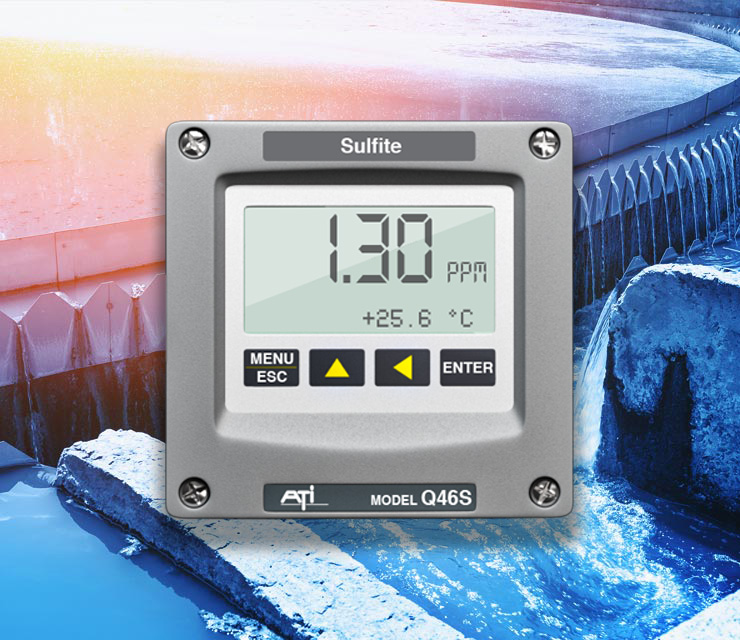
Reduce excess chemical overfeed with the Q46S Residual Sulfi…
The removal of chlorine before discharge to the environment from clean water and also waste water effluent is common practice…
Read
Get Street Smart with ATi’s MetriNet street-level telemetr…
Water quality monitoring has just got smarter with ATi’s latest innovation, the exclusive smart multi-parameter, street-level telemetry bollard.
ReadA team of experts, ready to help
A global company with a caring culture. We have a team of experts on hand to help with any product or support query you may have. Contact us and experience ATi’s exemplary customer support.
Get in touch


 Click here to see US contact details
  Click here to see UK contact details