Remote location water quality monitoring with MetriNet

SAFEgroup Automation (SGA) in Australia was engaged by Unitywater to design and install 8 multi-parameter water quality monitoring systems utilising our ultra low powered M-Node digital water quality sensors.

This project comes as part of Unitywater’s Digital Neighbourhood program which aims to transform their water and sewerage network. This will result in an intelligent data platform where advanced analytics can be used to provide data-driven decision-making, that will ultimately benefit Unitywater and its customers. Previous projects under this program include the installation of smart metering and leak detection in the water reticulation network.

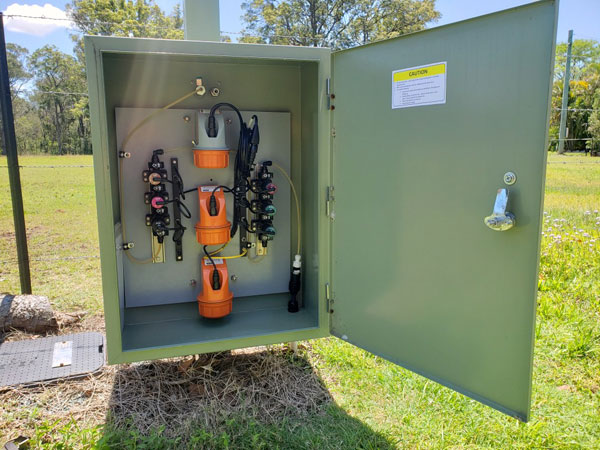
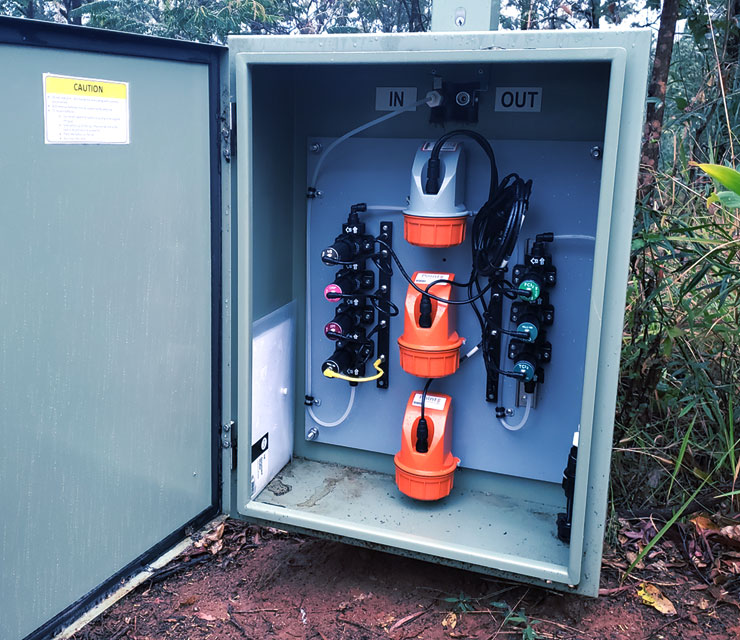
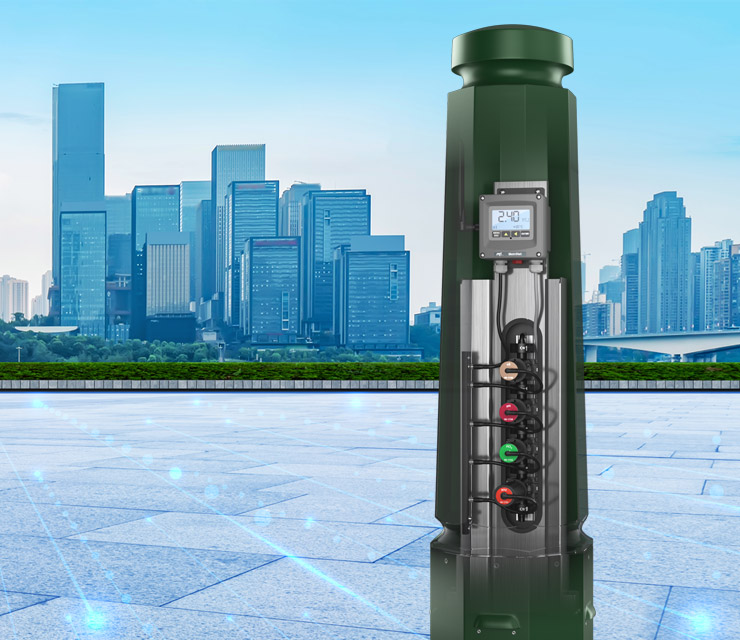
Limited by a lack of site power and communications, the battery powered MetriNet water quality monitoring system from ATi was an ideal fit for the task and was installed alongside the Metasphere Point Orange RTU with NB IoT cellular communications. This ultra low power system communicates with a high level of accuracy and resolution back to Metasphere’s Palette cloud platform. The RTU is also capable of communicating via DNP3 protocol directly to Unitywater’s SCADA system.

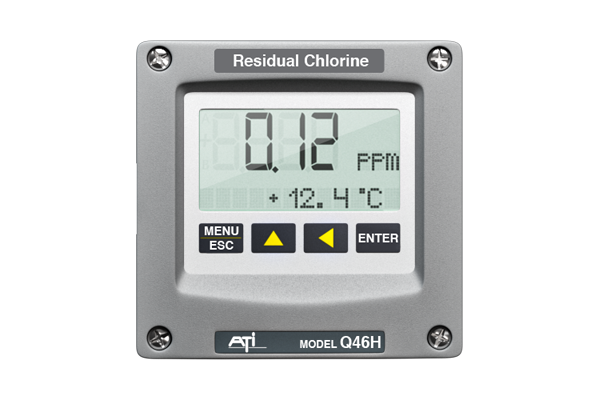
This project will play a key role in allowing Unitywater to understand the disinfection behaviour of the water reticulation network and understand the efficiency and effectiveness of the chlorine levels in next to real-time. This project is just another step in ensuring the delivery of consistent high-quality water to customers.

The MetriNet smart water quality monotoring system was required by Unitywater to measure and monitor the following water quality parameters:
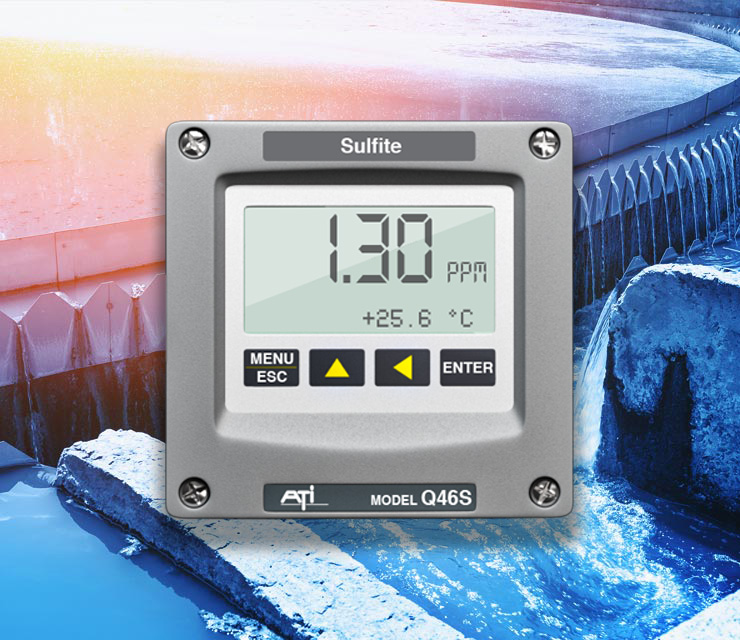
• Total Chlorine
• Combined Chlorine
• Free Chlorine
• pH
• ORP
• Conductivity
• Pressure

Featured Article

Related content


Case Study icon
Case Study
Analyzing the nuances of water quality data

Water quality monitors and data can confirm if chlorine, or other water quality parameters, are generally at levels…

Read
Case Study icon
Case Study
Chlorine spikes and what they can tell us

Chlorine residuals change during dosing and when the dosing equipment is paused, this is taken as normal operation…

Read
Editorial icon
Editorial
Embracing data for the future of smart water networks

Intelligent gas detectors play a vital safety role in areas where staff are routinely present, offering protection from…

Read


A team of experts, ready to help

A global company with a caring culture. We have a team of experts on hand to help with any product or support query you may have. Contact us and experience ATi’s exemplary customer support.

Get in touch

Remote location water quality monitoring with MetriNet

On-line monitoring of ammonia in water is of increasing importance due to the growing emphasis on nutrient reduction in lakes, streams, and estuaries. This flexible monitor is especially suited to environmental applications such as river inlet monitoring or waste water final effluent, plus the Q46N also measures free and total ammonia and is designed for the control of chloramination processes.

Alternative, simple direct measuring sensors have not proven sufficiently reliable and rather complicated systems have been developed to address the measurement problem. These systems can be used but require substantial maintenance and are expensive to purchase.

ATi has developed a new approach to on-line monitoring of ammonia that is easier to operate and less expensive than competitive systems, but with the reliability you need.


• Fast response time for real-time ammonia measurement
• Simple chemical system uses inexpensive reagents
• Display of Free Ammonia, Monochloramine, and Total Ammonia for chloramination systems
• Automatic response verification for ammonia breakthrough applications
• Multiple digital communication options: Profibus, Modbus or Ethernet

Applications

The Q46N ammonia monitor is available for a wide range of applications including:

  • Chloraminated potable water
  • Wastewater effluent
  • Potable water intake
  • Ammonia chillers
  • Aquariums
  • Fish farms

Operation

Ammonia measurement is accomplished by the addition of three reagents, each of which is fed using a multichannel peristaltic pump. A stabilizer chemical is injected first to stop calcium precipitation in the tubing. After that, a solution containing free chlorine is injected which results in the conversion of ammonia to monochloramine.

The third reagent added quenches the above reaction by removing the excess free chlorine. This ensures that free ammonia in the sample stream is converted to monochloramine, and dichloramine formation does not occur. Once chloramine formation is complete, the sample is temperature stabilised and pumped to a flowcell containing a special amperometric membraned sensor. This sensor measures the monochloramine formed in the chemical system and produces a highly linear output that is amplified and displayed in the monitor.

Chloramination System Monitoring

Chloramination in potable water treatment has become common, especially in utilities with large distribution systems. The use of chloramines to reduce disinfection by-products and to provide disinfectant protection throughout a large pipe network has proven useful but does present potential water quality problems if not controlled properly .A carefully controlled chloramination system will result in the conversion of all free chlorine to monochloramine with only a slight excess of ammonia. This excess ammonia, called ‘free ammonia’, should be kept as low as possible to avoid the formation of nitrites and nitrates in the distribution system.

Minimising the free ammonia concentration requires the accurate measurement of free chlorine to pace the ammonia addition, and also requires an accurate measurement of residual free ammonia. A special version of the Q46N Ammonia Monitor provides the capability of monitoring free ammonia by continuously measuring both total ammonia and monochloramine concentrations. Free ammonia concentration is then derived from these values. Two sensors integrated into the Auto-Chem chemistry system provide the required measurements. A sensor located in the inlet assembly measures monochloramine concentration in the chloraminated water. After addition of reagents, a second sensor measures the total ammonia concentration. The electronic monitor subtracts the monochloramine ammonia from the total ammonia and displays the free ammonia value.

Ammonia Response Verification

Total ammonia monitors are frequently used in applications where ammonia is not normally present. Under normal operating conditions, refrigeration systems utilising ammonia chillers have no ammonia in the process water. An ammonia monitor would display 0 PPM until a leak occurs. The Q46N Total Ammonia Monitor provides an automatic response verification system that confirms that the system is functioning properly. At user programmed intervals, a 1 PPM ammonia solution is introduced into the sample stream and the response is monitored to confirm the system is functioning properly. Outputs and alarms are inhibited during the test and an alarm is generated if the unit fails to respond. This system is not used for applications where ammonia is normally present but is very useful for ammonia breakthrough applications.

Featured Article

Related content


Case Study icon
Case Study
Analyzing the nuances of water quality data

Water quality monitors and data can confirm if chlorine, or other water quality parameters, are generally at levels…

Read
Case Study icon
Case Study
Chlorine spikes and what they can tell us

Chlorine residuals change during dosing and when the dosing equipment is paused, this is taken as normal operation…

Read
Editorial icon
Editorial
Embracing data for the future of smart water networks

Intelligent gas detectors play a vital safety role in areas where staff are routinely present, offering protection from…

Read


A team of experts, ready to help

A global company with a caring culture. We have a team of experts on hand to help with any product or support query you may have. Contact us and experience ATi’s exemplary customer support.

Get in touch

Remote location water quality monitoring with MetriNet

Disinfection monitoring by accurately controlling a dose of sterilant to clean pipework in the food and beverage industry is vital to the taste, quality, safety and life of the food or drink being produced, along with the health and wellbeing of the consumer.

As with any disinfection system, maintaining reliable residual values is the key to effective pathogen control. To facilitate consistent chemical feed control, ATi aqueous Q46/84 hydrogen peroxide (H2O2) and Q46/85 peracetic acid (PAA) monitors respond rapidly to changes in concentration, enabling operators to monitor and control chemical feed to maintain specific targets.

Historically, the cleaning time of the pipework was more time consuming due to the lack of reliable monitoring equipment. The longer the cleaning process, the more expense incurred due to using more chemicals and increasing ‘down time’.

However, Cleaning-in-Place (CIP) is now a widely used method of cleaning process equipment in the food and drink industry, usually applied daily depending on the production technique and industry. This ensures a consistantly high product quality, efficient heat transfer in heat exchangers and reduces the risk of micro-organisms growth.

Sterilants such as hydrogen peroxide (H2O2) and peracetic acid (PAA) are used to clean the equipment, using a strength of around 250 – 350 PPM and stored in large vessels. Once the solution is used, more is made and is topped up. This method of ‘topping up’ has proven difficult to maintain the correct level and keep its strength after multiple uses on site.

Colorimetric titration has often been the only method used due to issues with continuous dosing to a set-point (PID control). The risk of not reaching the correct level of PAA or H2O2 could result in the ‘dumping’ of product and then a deep clean, meaning high cost and low output due to down time.

After years of successful monitoring and controlling of PAA and H2O2 at several leading food and drink manufacturers and dairy companies, ATi’s specialist Q Series range of monitors have proven to be innovative and effective tools that improve efficiency and cost effectiveness on site.

After a recent six month trial of the Q46/85 at a leading food and drink company, the data showed that the sensor required no calibration or maintenance, which is typical of ATi Q Series range of sensors.

The Q46/85 uses electro-chemical sensing technology to control a continuous dose of peracetic acid during CIP. The sensor can be connected via analogue output or PID control to a dosing pump for continuous monitoring and control to a specific set-point. ATI’s Q46/84 hydrogen peroxide monitor is designed to continuously measure the concentration of H2O2 in aqueous systems.

The design of the sensor used in both the Q46/84 (H2O2) and Q46/85 (PAA) applications has the same building attributes as the free chlorine and dissolved ozone sensors that are the benchmark within the water industry. The accuracy and reduced maintenance of these types of sensor, adaptable to a wide variety of applications, is one of the many reasons that ATi are framework suppliers to the majority of UK water utilities and multiple OEM’s worldwide.

Featured Article

Related content


Case Study icon
Case Study
Analyzing the nuances of water quality data

Water quality monitors and data can confirm if chlorine, or other water quality parameters, are generally at levels…

Read
Case Study icon
Case Study
Chlorine spikes and what they can tell us

Chlorine residuals change during dosing and when the dosing equipment is paused, this is taken as normal operation…

Read
Editorial icon
Editorial
Embracing data for the future of smart water networks

Intelligent gas detectors play a vital safety role in areas where staff are routinely present, offering protection from…

Read


A team of experts, ready to help

A global company with a caring culture. We have a team of experts on hand to help with any product or support query you may have. Contact us and experience ATi’s exemplary customer support.

Get in touch

Chlorine spikes and what they can tell us

Chlorine residuals change during dosing and when the dosing equipment is paused, this is taken as normal operation within acceptable parameters. In this case study we want to explain what the real data examples can mean is happening at the local pipework and equipment close to the dosing point of application (POA)

Fig 1 is a typical POA on any main. There could be various combinations of this configuration such as, no pre dose analyser, no mixer if sufficient pipe lengths are available or a pump is doing the mixing. You may know of other options. The main may be before or after a reservoir, or a pump or simply in a trunk or distribution main directly into supply.

Fig 1

The position of the set up has its inherent problems and the consequences of the chlorine doing strange things has differing seriousness depending on this, as per the graph. It may also be that there are no consequences that need cause concern.

Fig 2 is real data, in this case from the inlet to a reservoir. The additional red and green lines are added examples but are true in nature and indicate real data from other sites. The Key should help us see when the flow starts and stops and the residual change and dosing set point. We will also see what happens when the rig is off that may cause problems and concerns, some of which in certain circumstances are not an issue.

A = Flow starts, B = Flow stops, C = Chlorine target level
Blue line = Chlorine residual, 1 – 2 = Residual decay in static water

1. The flow has stopped and the residual between points 1 and 2 slowly reduces over two periods of 6 or 7 hours each. This could happen for more than one reason.

• The flow to the cell containing the sensor has no flow to it and the static water is losing residual normally. The issue here is not the reducing residual but the flow to the cell if low level alarms are in place. Reasons of no flow to the cell will need investigating if alarms occur or there is to much lag in a good residual reading when flow re starts as this may affect initial dosing control.

• The flow to the cell is now from water in the main with only background residual and that chlorine content is slowly degrading. Issues are similar to the previous bullet point and again of little concern unless there are low level alarms that will shut the system down. If there is concern around having low alarms too low, then software and controls at the site will need refining. 

Although the data is from a post dose monitor a similar thing can happen on a Pre-Dose analyser, if fitted. In most cases it is of little consequence and understanding why it is happening may be all that is required if no control or warnings are related to a pre-dose analyser. The exception to this would be with a feed forward dosing system.

2. At the end of the second 1 -2 period there is a small spike. There is also an added red line that indicates data that has been observed at other sites, of a far bigger spike. Why spikes occur like this whether large or small are likely to be for similar reasons. There are a few circumstances that can cause these. The consequences can be very different for the larger spike in comparison to the smaller one. 

• The dosing lance is not a type that has a mechanism that inhibits Hypochlorite entering the main when the dosing is off. Due to drainage from the lance or line, as this is pressurised by the dosing pump. 

• The mechanism in the lance for inhibiting lance/line drainage is not suitably adequate (due to pressure) or is in need of maintenance. Failure of other mechanisms in the dosing rig equipment may also contribute to this.

• The amount of hypochlorite within the end of the lance, after any self-closing mechanism, is enough to increase the residual at the local point in the main at POA All the above can be in part due to the pressure in the dosing line being greater than the resistance in an inhibiting device in the lance or a “loading valve” and or the mains pressure. There will almost always be some residue at the POA that will enter the main when dosing pumping stops.

This data and occurrences as indicated can have little or no detrimental effect. However, there can be some serious consequences suggesting some understanding of why this is occurring and if a resolution is required.

Usually this high residual is local to the mixer and pipework at the point of application and is a residual eventual seen due to travel within the local pipe. This is not usually harmful to customers as the high levels dissipate immediately the mains flow starts.

A high-level spike could cause a rig shut down, if the software controlling the rig, is set up that way. 

Things to look at to resolve are, how much time passes before the spike appears, how high does it go, how long does it last and how quickly does it go when dosing re starts? There are likely other factors to consider too.

The consequences for a post dose analyser seeing these spikes may or may not be detrimental and investigation will determine this. However, should a similar thing occur on a pre dose analyser the consequences can be completely different. The causes and remedies will also be different.

The Green line spike example between the first 1 – 2 points on the graph is also indicative of the points above. However, though this may be due to a mechanical failure or lack of maintenance it may not be an easy fix if it continues.

With earlier examples a fix in the control software might get around this but this may not be so easy due to the time period covered when the elevation starts to occur. The solution may be a redesign in the dosing line / lance and POA. Each site will require its own evaluation for a solution.

Featured Article

Related content


News icon
News
Badger Meter Enhances Smart Water Capabilities With Acquisit…

Badger Meter continues to invest in its industry-leading smart water offerings. and is pleased to announce the acquisition of Syrinix, Ltd, a privately held provider of intelligent water monitoring solutions.

Read
News icon
News
Reduce excess chemical overfeed with the Q46S Residual Sulfi…

The removal of chlorine before discharge to the environment from clean water and also waste water effluent is common practice…

Read
News icon
News
Get Street Smart with ATi’s MetriNet street-level telemetr…

Water quality monitoring has just got smarter with ATi’s latest innovation, the exclusive smart multi-parameter, street-level telemetry bollard.

Read


A team of experts, ready to help

A global company with a caring culture. We have a team of experts on hand to help with any product or support query you may have. Contact us and experience ATi’s exemplary customer support.

Get in touch

Remote location water quality monitoring with MetriNet

ATi’s Senior Service Engineer, Mark Holmes, discusses the cutting-edge technologies available for measuring and monitoring sludge blanket, providing optimum efficiency and flexibility through smart, ultrasonic and continuous, real-time measurement.

Measuring and managing the depth of sludge blanket is one of the most critical challenges in the production of good-quality effluent from wastewater treatment plants. Aside from lessening the environmental impact of human waste, modern wastewater treatment plants have embraced advances in science and technology that allow significant, positive inputs, such as producing energy from biogases, such as methane, and in some cases generating revenue streams from processed biosolids, including nutrient-rich fertiliser for farming.

However, for these advanced systems to work effectively, one of the most crucial parameters for plant operators to monitor is the total solids, or sludge, as it moves through the plant.

EchoSmart Interface Level Analyser

Although the composition and concentration of sludge varies throughout the treatment pathway, understanding the settling characteristics of sludge is vital to optimise control of the plant and wastewater process. Primary sedimentation, biological stages, secondary treatment, effluent quality, and subsequent sludge handling are all greatly affected by how well the settling has been achieved and, importantly, monitored.

Effective automation to improve process control

By measuring sludge levels in both primary and secondary sedimentation tanks, operators can ensure sludge extraction pumps are used efficiently and ensure poorly settled sludge does not carry over into effluent paths.

By measuring sludge levels, operators can study sedimentation characteristics of suspended solids in the plant, understand sensitivities due to disturbances and manage sludge levels to allow sufficient buffering for incoming hydraulic load variations.

While no two waste-water treatment plants are identical, the push to improve efficiency through automation and improved process control is a common theme.

Relying solely on manual sampling means that thorough analysis of plant characteristics and trends is limited to the frequency of sampling, with the addition of labour costs. In a plant with continuous, automatic measurement of critical process variables, there is a wealth of feedback that creates a robustness of system control, capable of rapidly identifying disturbances or operational problems.

Contactless sludge blanket level measurement

For measuring the depth of sludge blanket, two conventional methods are widely used; contact and contactless methods. The contactless method is considered more desirable, as it doesn’t depend on direct measurement by human operation.

One leading example of contactless measurement is ATi’s EchoSmart, designed for superior sludge level detection in a wide range of water and wastewater applications. The EchoSmart sensor generates an ultrasonic sound wave that propagates through a liquid medium and is reflected back from material that is present in the vessel, which are typically settled solids, suspended solids, or the tank bottom.

The sound wave travels at known velocities, providing the ability to convert elapsed time into Range and Level measurements, offering continuous, real-time measurement. The underwater acoustic measurement principle allows the sensor to track well settled blankets, as well as being configured to track dispersed solids, such as ‘fluff’ or ‘rag-layer’. 

The EchoSmart sensor does more than just produce a raw signal; it is equipped with an advanced programmable microprocessor and dynamic memory. Through these facilities, the sensor provides all signal control, enhancement and interpretation, and determines the final process measurement. The smart sensor also communicates with an EchoSmart Controller via digital communication, offering greater flexibility in equipment configuration options, enhanced communication capabilities and reduced installation costs.

Flexible, smart networked monitoring

EchoSmart can be used for a wide range of applications and industries, such as sludge thickeners in wastewater, primary or final settlement tanks, and also within the clean water treatment process, including clarifiers on water treatment works. It is adaptable and can be programmed to suit various shapes and tank sizes, with the additional option for turbidity measurement, offering further insight into tank and solids activity, which is useful for less dense blankets. 

There are also options available for a variety of installation requirements, including a remote or local controller, a stand-alone system, or alternatively a network of up to 16 sensors can be added to one controller. Communication can be achieved through hard wired connections or radio-link network, which can eliminate the need for costly installation. The system comes standard with analogue and digital outputs, as well as Modbus, but other digital communications can be attained if required. 

The EchoSmart sludge blanket level monitor is simple to install and operate, providing an advanced yet user friendly solution, offering cost effective, trouble-free and reliable measurement.

Featured Article


  • Environment
  • Sensors
  • Septicity
  • Sludge Blanket
  • Wastewater
  • Water Quality

Related content


Case Study icon
Case Study
Analyzing the nuances of water quality data

Water quality monitors and data can confirm if chlorine, or other water quality parameters, are generally at levels…

Read
Case Study icon
Case Study
Chlorine spikes and what they can tell us

Chlorine residuals change during dosing and when the dosing equipment is paused, this is taken as normal operation…

Read
Editorial icon
Editorial
Embracing data for the future of smart water networks

Intelligent gas detectors play a vital safety role in areas where staff are routinely present, offering protection from…

Read


A team of experts, ready to help

A global company with a caring culture. We have a team of experts on hand to help with any product or support query you may have. Contact us and experience ATi’s exemplary customer support.

Get in touch

Remote location water quality monitoring with MetriNet

Following a successful trial, United Utilities has selected ATi as its preferred provider for final effluent ammonia monitoring in three of its Lancashire waste water treatment plants, saving them up to £2,000 a year in maintenance costs.

The Leyland and Chorley sites were initially selected to test two Total Ammonia Monitors on final effluent and the results were, in the words of plant manager Martin Gilday, “fantastic”.

Comparison data from Leyland over a two month period, shown in Figure 1 (FE Ammonia Comparison Data), demonstrates how manual testing on site corresponded to ATi’s online monitor.  Based on these results – their most accurate ever – United Utilities have now made the installations permanent, along with further installations at a third plant, which will see them save up to £2,000 a year in maintenance costs.

Figure 1

To date over 30 other sites across the UK and Ireland have installed ATi’s Q46N final effluent technology, with a further 50 plants also scheduled for installation this year.  These sites typically have an effluent consent of 5 mg/l or less, and any failure to comply with the discharge consent could lead to hefty financial penalties under the OFWAT performance assessment.  However the Leyland and Chorley plant is a particularly well maintained site, therefore effluent is typically even lower in ammonia concentration and is difficult to detect with other technologies, such as ion selective electrodes.  However the Q46N unique reaction chemistry gives a five times uplift in sensitivity, allowing measure at levels as low as 0.02ppm, 20 parts per billion.

Accurate, first class results

Continuous measurement data is crucially important to confirm treatment facilities are operating efficiently.  By using the Q46N monitors, measurements can be retained on an internal datalogger, with data downloaded periodically or transmitted via GPRS to a dedicated server, which feeds a website to enable 24/7 access to live water quality information. 

Figure 2 (new Q45N three week Continuous FE Measurement) shows recorded data taken during the trial.  No calibration or maintenance was necessary during this period.  The data shows several weeks of unattended use, with reported ammonia levels often running below 0.2ppm. 

Figure 2

All monitors in the trials were installed with a Rotorflush submersible pump, fitted with a 150 micron filter.  After three months, each site was visited to determine the extent of system fouling and to carry out maintenance.  Although there was evidence of some particulate build-up (Image 1 – Particulate Build-up), this does not prevent the monitors from working and results showed how they continue to operate effectively without calibration during this time. 

As part of the maintenance checks, the monitors were then validated using an ammonia standard, with the sensors responding and recovering quickly to the sample levels (Figure 3 – Ammonia Validation). 

Figure 3

Results also demonstrated that over the three month period there had been a slight drop in the sensor calibration slopes, suggesting that on final effluent applications a calibration every six weeks would be appropriate.  Calibrations can be carried out within 10 minutes and could be done at the same time as when the reagents are changed.

New product developments

Since installing the original Q46N monitors to the United Utilities plants, several developments to the original design have been incorporated following feedback from customers, which identified the need for two types of final effluent monitor.  Whereas the preference of some water companies is for a monitor that requires regular manual calibration, others require a monitor that features an auto-calibration, so it both responds and calibrates automatically.  Automatic validation of measurement provides the best possible confidence and calibrates against two known calibration standards to enhance accuracy and raises awareness of unacceptable performance.

Following this feedback, ATi have been offering automatic validation for the Q46N since the end of 2013.  ATi has also worked closely with Rotorflush as part of these trials and recommends their self-cleaning pump for all final effluent applications.

Substantial operational and cost benefits

Martin Gilday, United Utilities Plant Manager, believes that ATi’s Q45/46N dissolved ammonia monitors offer substantial operational and cost benefits: “The low cost of operation and accuracy of results has enabled us to make a number of changes to plant performance, which has greatly reduced the risk of failure. Already the instrument has proved invaluable, providing us with crucial trending data, identifying how upstream processes may be improved and ensuring compliance with the Environment Agency permit.”

“Our instrumentation selection was influenced by the quality of support ATi offers as part of its first rate customer service package, including free training, fast response times, low maintenance costs and high quality and efficient monitors.  This trial is generating a lot of interest amongst the management team and if we can prove that the lifetime costs are as low as they appear and if the unit continues to perform reliably, the low capital and maintenance costs will mean that ATi’s final effluent monitors could find application at a large number of our treatment works”.

Chris McTear, ATi Technical Support Manager, said:

“One of the main advantages of 24/7 data is that it helps to identify spikes and enables process operators to determine the cause of the problem, allowing them to adjust the treatment process. 

“ATi’s Q45/46N system allows you to deploy these monitors and get months of low maintenance, reliable monitoring, including MCERTS, for all pH and ammonia monitors.  The Dissolved Ammonia monitors offer a completely new and improved approach to simultaneous on-line monitoring of chloramines and ammonia in final effluent, which is simpler, cheaper and more sophisticated than conventional monitoring equipment.   

“Continuous data offered by the Q45/46N monitors also helps with the identification of treatment deficiency and data for multiple parameters provides a better understanding of the whole process. Regular sampling and analysis can be lower in cost than online monitoring, which is what some of our customers prefer, however this puts you at risk of a pollution incident going undetected between sampling times.” 

Featured Article

Related content


Case Study icon
Case Study
Analyzing the nuances of water quality data

Water quality monitors and data can confirm if chlorine, or other water quality parameters, are generally at levels…

Read
Case Study icon
Case Study
Chlorine spikes and what they can tell us

Chlorine residuals change during dosing and when the dosing equipment is paused, this is taken as normal operation…

Read
Editorial icon
Editorial
Embracing data for the future of smart water networks

Intelligent gas detectors play a vital safety role in areas where staff are routinely present, offering protection from…

Read


A team of experts, ready to help

A global company with a caring culture. We have a team of experts on hand to help with any product or support query you may have. Contact us and experience ATi’s exemplary customer support.

Get in touch